Measuring campaign success with Google Analytics – Part 2
phase3digitalagency • August 20, 2019
As we mentioned in our previous blog , you must be utilizing Google Analytics to judge the full performance of a digital campaign. With Google Analytics you can assess your overall web traffic and compare pre-advertising months to current advertising months to gauge campaign success. There are also a few other metrics that are important to determine the effectiveness of your campaigns. They are: Traffic Sources, Bounce Rate, Conversions and Behavior Flow.
- Traffic Sources – You will find this metric
under Acquisition > All Traffic > Source/Medium. This section will show
you all campaign traffic sources and metrics such as users, sessions, bounce
rate and session duration for each source. Make sure your digital advertising
agency is using UTM codes so that you can easily understand each source in the
table.
- Bounce Rate – This metric can be found in the
behavior column in multiple places in Google Analytics, but you can find
overall bounce rate for acquisition sources under Acquisition > Overview.
This metric tells you the number of users who enter your website, then leave
after viewing only one page. An average bounce rate is between 40-55%. If you
are seeing higher bounce rates than that, talk to your web team or your marketing
agency about ways to improve landing page effectiveness.
- Conversions – Google Analytics allows you to
track multiple types of conversions. A conversion occurs when the user takes an
action that you have set up as a goal in Google Analytics. Some examples are:
purchase, newsletter sign-up, phone call or download. You can set up goals
under Conversions > Goals > Overview > Set Up Goals and then click +
New Goal. If you have a digital campaign running with a specific conversion
goal, you will definitely want to set this metric up and track it.
- Behavior Flow – This metric can be found by going to Behavior > Behavior Flow. It allows you to follow a user’s journey from the time they arrive on your website to the time they leave. The data is displayed in a flowchart, and you can use this data to improve your website by seeing where users are dropping off.
Google Analytics can seem like a daunting platform, but knowing which metrics to focus on can be helpful. Phase 3 Digital can answer any of your Google Analytics questions and always uses these metrics when judging the success of our campaigns.

If you've been orbiting the digital marketing world for long, you'll know all about Google's plans to abandon the third-party cookie by 2022. The rules for cookies have already started to change thanks to the California Consumer Privacy Act (CCPA). Visit any website, and you'll get a "do you accept this cookie" pop-up. The fight for privacy and owning your data on the internet is just beginning. But what does it mean for marketers? First, this only affects third-party cookies. Websites that track abandoned shopping carts or where you have chosen to log in will still be active and working. ( x ) Those effective ads that follow you around to remind you to come back and buy? They are here to stay! Second, even though we're losing access to visitors’ individual data, Google already has a plan in place to target ads effectively. Google created the Federated Learning of Cohorts (FLoC) for this very purpose. The goal of the FLoC is to "provide an effective replacement signal for third-party cookies." ( x ) Any Google device or product you use will still file away your internet habits for advertising purposes; it will just be less precise. The idea is to shift people from individuals into broader categories. Those categories are what marketers will be targeting moving forward. If you're looking up how to replace a car battery on YouTube, you'll most likely be shifted into the "repairs vehicles" category and served ads accordingly. If we've learned anything from Facebook's targeting practices, it's that they can get very granular with those categories. The main takeaway from the loss of the cookie is that marketers everywhere will have to be more strategic about their targeting plans. Utilizing advertising avenues that never relied on cookies is a great place to start. Paid search, emails, and social media are just a few areas of focus that generate clicks and customers while not relying on cookies. Leveraging traditional media alongside digital will also be vital to help grow your audience and brand awareness. As always, you can reach out to our digital marketing team of experts to help you navigate the change. The cookie might be dead, but personalized digital marketing is still alive and well.
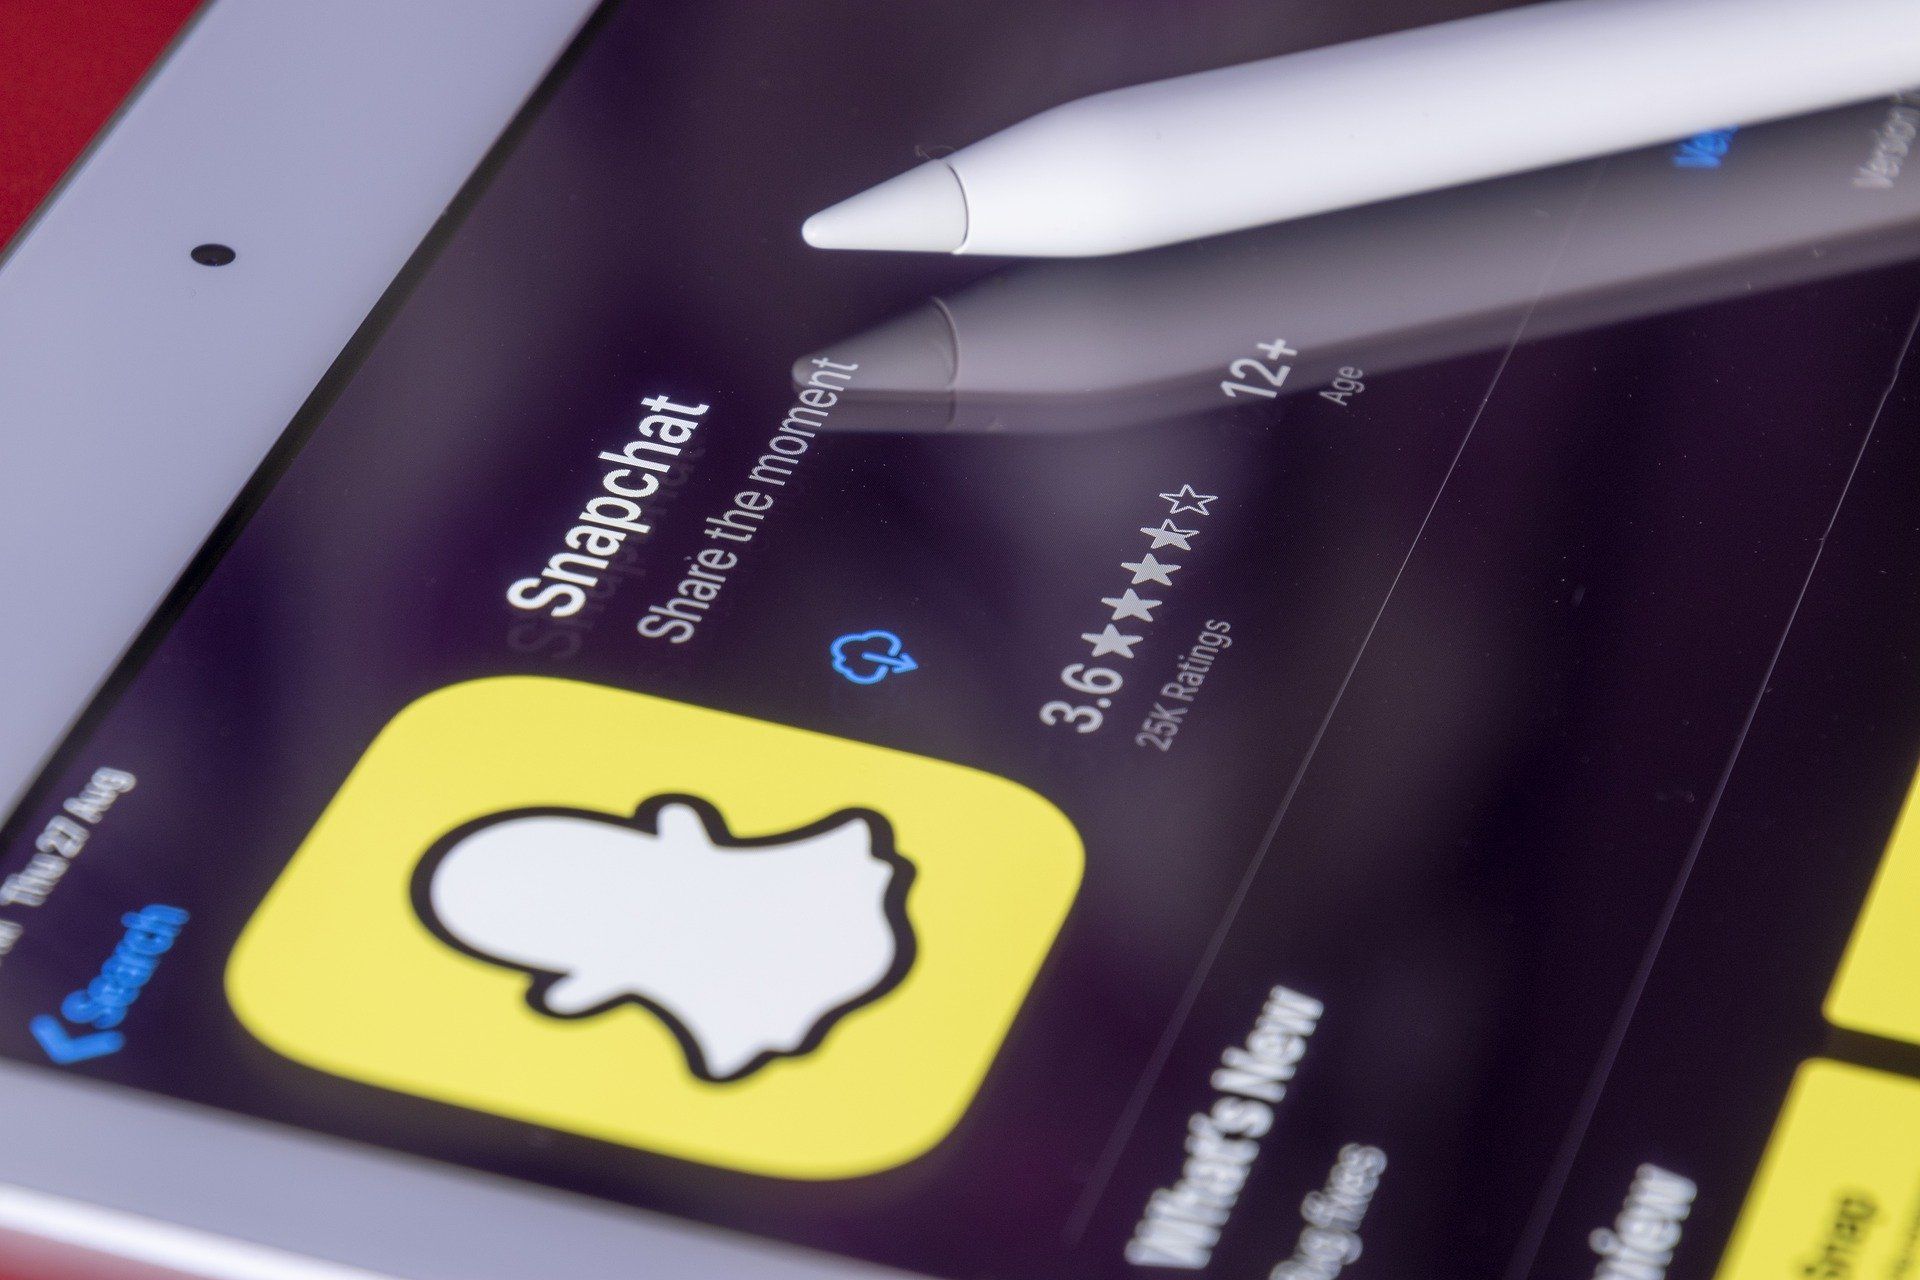
Although 2020 saw the rise in popularity of Tik Tok, there is another platform that marketers should focus on, especially if they are looking to hit a younger demographic. Snapchat remains one of the most popular social media apps for people under the age of 25. Snapchat was the originator of Stories, before Facebook and Instagram picked them up, and pioneered the idea of temporary interactions in the social media world. Before Snapchat, social media platforms were focused on permanence and timelines, and Snapchat decided it was time to freshen things up. Snapchat statistics About 249 million people use Snapchat every day* Snapchat reaches 75% of millennials and Gen Z* Snapchat estimates the average daily user accesses the Snapchat camera more than 20 times per day** Building Snapchat ads If you’ve ever done any Facebook/Instagram advertising, the options are fairly similar. You first choose your campaign goal: brand awareness, web traffic, video views, lead generation, conversions and more. Next you set your budget. Snapchat offers affordable advertising with a $5 per day minimum budget. After you set your location, you can select your demographic targeting. One perk of Snapchat’s demographic options is that you can select an age range from 13-50+. Also similar to Facebook, Snapchat has a large variety of audience targeting to choose from. But unlike Facebook, Snapchat is very transparent where the data is coming from. Data sources include Comscore, Placed, Experian, Datalogix and more, and are listed right next to the audience selection. Snapchat’s audience include various lifestyles, specific film/tv interests, specific food/beverage consumers, sports preferences, shopping habits, TV network and daypart viewers, and so much more! The opportunities for targeting are endless, and any brand can easily find audiences that fit their target market. Ad Formats Snapchat offers many ad formats, but the content that works best on Snapchat is video-driven storytelling. You can easily upload images that will be converted into a video if you do not have a video to use. You can also create filters to represent your brand in a fun way. Finally, a somewhat new offering are collection ads, which allow advertisers to showcase multiple products with thumbnail-sized images at the bottom of the ad. If your company isn’t utilizing Snapchat, it may be time to give it a try. If you are looking for help creating and managing Snapchat or any other social campaigns, our in-house team of experts is happy to help. * https://forbusiness.snapchat.com/ ** https://www.oberlo.com/blog/snapchat-statistics

Programmatic advertising has been on the rise for years thanks to its ability to adapt to what marketers need in reaching their ideal customer through display advertising. Now there is an additional programmatic advertising solution that allows you to find your next prospective customer on-the-go through Streaming Audio . Here are a few basic things to know: What is streaming audio? You have most likely experienced a streaming audio ad yourself. Streaming audio, also referred to as programmatic audio, is a digital advertising format for audio content like digital radio, podcasts, and music streaming services. Streaming radio ad spots are entered into a programmatic auction system and purchased if a listener matches the desired audience parameters. Listeners are exposed to a 15- or 30- second streaming audio ad on their mobile browser, desktop browser, or in-app while listening to a streaming audio service like Spotify, Pandora, SoundCloud, Triton, Targetspot, etc. Within some of these platforms, display banner ad components can be included for additional exposure. What makes steaming audio stand apart? First, streaming audio service users have increased significantly thanks partly to 2020’s global pandemic. According to Pandora, “three in four Americans have changed their routine due to the pandemic” – and their media habits have changed along the way. More people are working remotely, creating home gyms, taking part in virtual classroom learning, and dining out less due to capacity restrictions, leaving people to spend more time at home. “In May 2020, 70% of audio listening was happening in home vs almost 50% at the beginning of 2020, with a 16% spike on digital devices.” Second, with streaming audio, you are not only able to target your streaming audio campaign to a specific audience, but you are also able to measure the results of your ads and optimize the campaign in real-time. In addition to being able to attract a specific demographic, you can also send potential customers to your website when a display ad is placed alongside your streaming audio spot. Lastly, one of the greatest benefits of streaming audio ads is the guaranteed exposure. For example, if a user is on Spotify and an audio ad comes on, that user becomes your captive audience as commercial breaks are unskippable, meaning your full 15- or 30-second message gets played in its entirety for almost every impression. The same goes for online radio and podcasts, leaving the advertiser confident that every ad is gaining optimal exposure. What makes a good streaming audio creative? Ultimately, like programmatic display and OTT, listeners respond to clear open communication from an advertiser. Pandora, one of the leaders in streaming audio services, reports that best practice for effective streaming audio creative is a message focused “20% on what you say and the remaining 80% is how you say it.” Creating an informative and relevant message while being personal, optimistic and/or empathetic will lend you best results. When you add in the flexibility that streaming audio offers with adjusting your messaging in real-time, streaming audio makes it easy for your brand to remain relevant in the ever-evolving digital landscape. With more and more people plugging into digital audio each year, now is the time to include streaming audio in your programmatic campaign buy. By adding streaming audio, you will reach your audience with relevant, contextual ads that keep listeners engaged, while building loyalty to your brand.
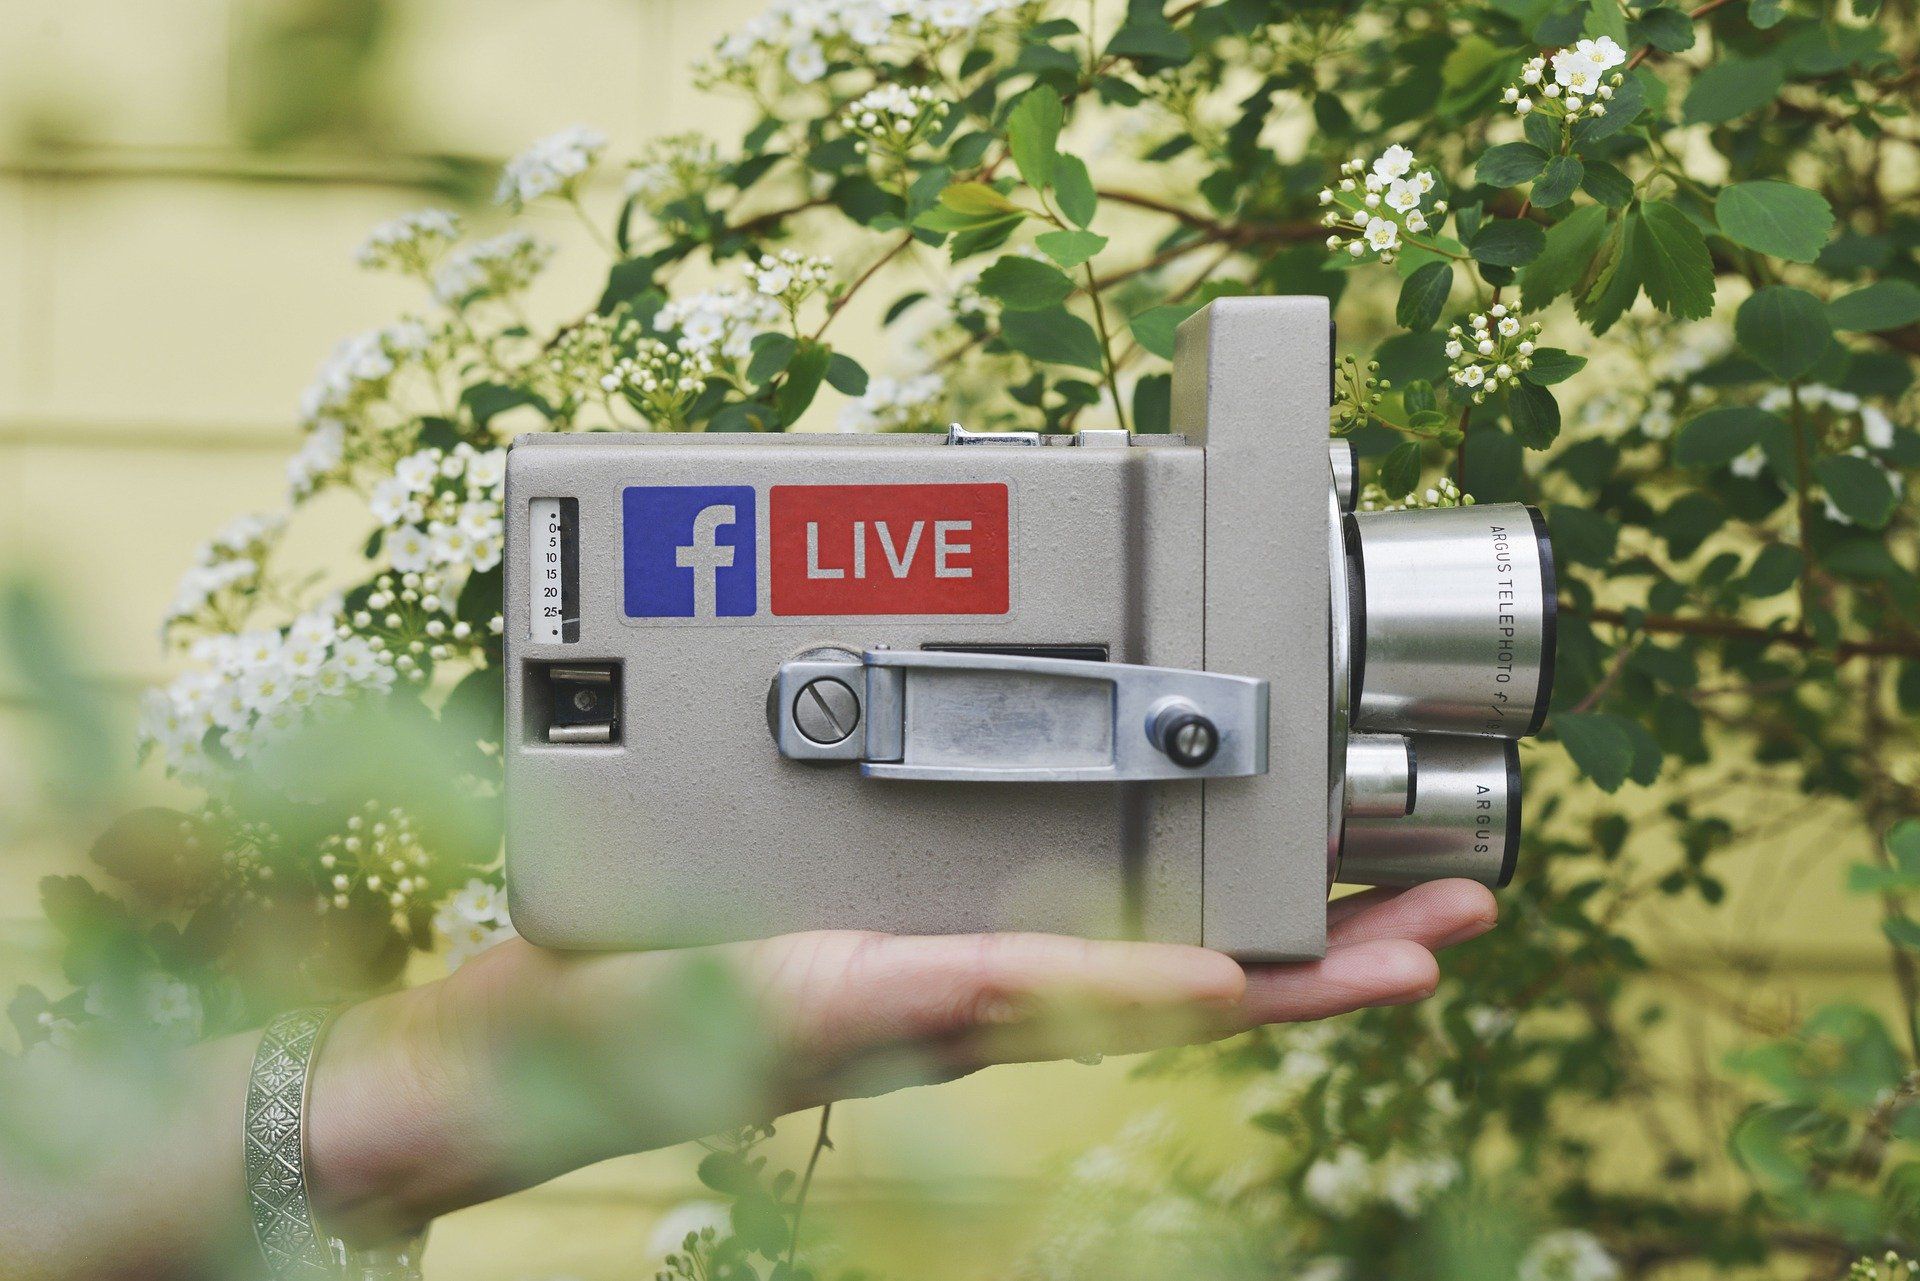
Social media has made it easier to connect with your customer base in an inexpensive way. It has become common practice for businesses to set up scheduled posts to maintain an active account and display their product or services weekly. However, as it usually does, the game has been modified through Facebook Live. Facebook Liveis the ability to broadcast to your Facebook audience a live video feed from a camera source and let them see whatever it is you are currently doing. It is extremely popular with direct marketing companies (Lularoe anyone?). In broad terms, it gives you the opportunity to be a star in your very own TV show! The Good: Facebook Live allows you to do special events that allow your customers and clients to feel like they are a part of the behind-the-scenes action in your company. It also allows you to communicate directly, albeit slightly delayed, with customers who are watching. Some businesses like to announce upcoming special sales or events via Facebook Live to make their followers feel like they are getting priority information, and who doesn’t like to feel special? The Bad: With Facebook Live you are only streaming to a very select audience. Its reach is limited to the number of followers you have, and the engagement from shares that you may receive. Do not be discouraged if you only have 10 of your 500 followers watching you live with no additional shares. You also need to be aware of your sound quality. There is no point in having a live stream going if it is going to be the equivalent of a silent film. Bad sound quality, or shaky video for that matter, will quickly tank your Live. The Ugly: On the same vein as being a live TV show, what you say is out there forever. There is no editing power on a live video, so make sure you prepare what you will be saying. Also, be aware of your surroundings! Remember to have a clean background behind you, good lighting and no one running around underdressed! We’ve all seen the video of the online business meeting where a woman took her phone with her to the restroom. Don’t be the restroom woman! The best practice for Facebook Lives is to plan ahead, prepare your talking points in advance, clean the area you’ll be presenting from, schedule posts leading up to the live to let your followers know and have fun. Results will vary from business to business, but it’s always fun to be your own star.
Advertising on Facebook has grown in prominence in the digital and mobile advertising space for both local business and large corporations. With its growing usage, Facebook has become a regular in the news, facing much scrutiny for its utilization of data collected on users to optimize mobile advertising delivery. New announcements from Apple with the unveiling of iOS 14 has created noise around the Facebook Advertising platform which will not only affect advertising on Facebook, but also the Facebook owned social media platform Instagram. Originally announced to take place in September as soon as the iOS 14 update became available, but now delayed until 2021, Apple has created a privacy feature which will require apps to ask users for permission to track or access their device. In 2021 iPhone owners with the update will be given a notification stating, “’x-company’ would like permission to track you across websites and apps owned by other companies to deliver personalized ads to you”. This affects all companies that use and collect data to deliver advertising, but this is especially detrimental to Facebook’s advertising platform, with the company claiming that the update “may render Audience Network so ineffective on iOS 14 that it may not make sense to offer it on iOS 14.” With users not opting in to sharing data, the effectiveness of targeting users on Facebook will be severely crippled and will likely cause a shift in mobile ad spending in 2021. Facebook said that in testing it saw greater than a 50% drop in revenue as a result in the data loss from Apple. It is important to note that this change will only affect iPhone users with the update, leaving iPhones that aren’t updated and Android devices still open to normal tracking for the time being. However, with a trend towards greater protection of online consumer privacy it is becoming a priority for businesses to begin building their own internal databases of customer information to continue successfully marketing online. Phase 3 Digital is working proactively to help mitigate the effects of what is being termed “death of the cookie” by helping brands to build first-party data at a rapid pace. Methodology for accomplishing such means is done through mutual exchanges in which consumers voluntarily share their data with brands, which can in exchange be utilized to continue providing customized messaging, such as building email lists for brands and hosting sweepstakes. Looking forward, with the coming changes brands will be able to further trust brand equity and overall relationships with their customers as the ever-changing online landscape further revolutionizes. We will continue to monitor the developing situation and keep our clients apprised of any changes, while closely monitoring all campaigns!

2020 is a number that has created a meaning all its own. 2020 is now a number that means so much to every person, at the same time holding a meaning unique for everyone. We’ve curated the most need-to-know or just interesting to know findings from 2020 in a marketer’s world. WordStream outlines the top 10 online marketing and advertising stories. These stories include the shift in consumer and business habits as it pertains to the pandemic, social and political issues. Adoption of online resources was pretty much forced. Not being able to dine at your favorite restaurant, not feeling safe at the grocery store, not being able to visit a doctor or your bank, for example, all resulted in the need to download apps, use telemedicine and do a lot of what normally would be done in-person, now online. Speaking of apps, app downloads climbed 33% with massive organic demand for non-gaming apps. Fast numbers from Falcon.io: Facebook’s analytics department reported a 50% surge in messaging during first ‘stay in place’ orders in March 2020 WhatsApp saw a 40% lift in usage TikTok global downloads grew 5% February to March, adding over 12 million unique US-based visitors 70% of Instagram users view stories daily, with 62% becoming more interested in a product or brand after seeing it featured in a story 62% of consumers want companies to advocate for the issues they’re passionate about 33% of consumers would intentionally buy more from a brand that voiced a controversial opinion congruent with their beliefs Lockdown measures have accelerated the shift to e-commerce by 5 years, and social commerce is rising along with that wave. Instagram expanded shopping features Facebook launched Facebook Shops in September 2020, poised to be a new Amazon TikTok launched a “shop now” button Snapchat was in e-commerce early but has since offered augmented reality and filters for people to try on makeup and clothes before they buyvia the platform 2020 global commerce is $89.4 billion, with the US comprising $26.9 billion of that. Forecasted to cross $600 billion by 2027. So, what brands were people resonating with? Check out YouTube’s ads leaderboard that showcases the top 10 ads that people chose to watch on YouTube this year in the US. Video is its own category, and 2020 solidified its space even further. Download white papers from Comscore for key findings such as: In March 2020 the amount of average daily OTT households increased by nearly 6 million Local and national TV viewing spiked in March regardless of shelter-in-place orders, most likely due to the increase of news programming consumption Smart TVs fastest growing streaming segment grew 45% in April year-over-year Reach of ad-supported services outpaced that of non-ad-supported services by 4% OTT content viewing has become mainstream media behavior on the U.S. with almost 70 million homes using OTT and an average of 102 hours of OTT content viewed in a month’s time 3 marketing and advertising industry leaders sum up 2020 in one word. Watch it HERE . 2020 has forced a progression and acceptance of online platform and device usage that will carry into 2021. Businesses who were planted in the online space succeeded. Those who did not have an online presence, who could not communicate effectively with their customers online, or who could not provide their products or services in a remote way, felt the most hardship. As marketers we will work with your business to improve your online health and messaging, as your customer’s habits continue to shift and they engage with you digitally. Resources: https://www.wordstream.com/blog/ws/2020/12/14/top-digital-marketing-stories-2020 https://www.appsflyer.com/blog/top-5-trends-app-marketing/ https://www.falcon.io/ https://www.thinkwithgoogle.com/marketing-strategies/video/youtube-leaderboard-year-end-2020/ https://www.comscore.com/Insights/Presentations-and-Whitepapers/2020/State-of-OTT https://www.thinkwithgoogle.com/future-of-marketing/management-and-culture/sum-up-2020/
Commuting from his trailer via longboard to his job at a potato plant while drinking Ocean Spray cran-raspberry juice and singing Fleetwood Mac’s “Dreams,” Nathan Apodaca of Idaho Falls had no idea that he was filming the most successful advertisement in the history of Ocean Spray. The joy-filled, 22-second clip , originally posted to the increasingly popular video sharing app Tik Tok, has garnered 73 million views on the app alone, with Apodaca himself amassing over 6 million followers in the 3 months since he went viral. So, what turned this video into a powerhouse that nearly doubled the Ocean Spray stock price and skyrocketed “Dreams” up to No. 1 on the iTunes charts 33 years after its release? Humanity is arguably the main reason for the overwhelming success of Apodaca’s video-turned-ad. It isn’t as though he began this journey as an influencer, or someone with a significant number of followers. In his words, he just likes juice and needed to get to work. 2020 has proven to connect us humans together with a gritty thread, often finding more commonalities in the struggles than successes. Apodaca had been dealing with water and electricity outages in his trailer, and his truck broke down (thus, the skateboard) in the weeks leading up to his virality. Posting the video a couple minutes before his shift, he almost considered taking it down since phones were not allowed on the plant floor. Luckily, he did not. And by his second break of the day, the clip already had 2 million views. Now, no one can necessarily plan on going viral. And perhaps that’s why this video turned into the beast of a marketing opportunity that it did. It was real, it was relatable, and it was human – everything a lot of advertiser’s couldn’t seem to get right in the COVID-19 era. But the success of this Tik-Tok-turned-advertisement would have never, not in a million years, be something Ocean Spray itself would have created organically. Marketing expert Mark Schaefer concludes that this is what executives at Ocean Spray would have likely said to an agency that created the same video: 1. That person does not represent our core values or targeted consumer base 2. Legal won’t approve of this video because he is engaging in risky behavior – he’s not wearing a helmet. What if people try this stunt and sue us? 3. He’s drinking right out of the bottle, which is off-brand 4. You can hardly see the product or logo The video ended up working overtime in Ocean Spray’s favor because Apodaca was in control of the messaging. This time, Ocean Spray didn’t get to tell anyone who they were. We were told who Ocean Spray is by Nathan Apodaca – and oh, what an uplifting message it was. COVID-19 has changed many things. But one huge takeaway is that people are struggling, and they no longer appreciate advertisements trying to sell them an extravagant product. Polished, perfect, branded ad tactics are beginning to fail, and human-centric tactics are becoming increasingly effective, if not necessary, in bringing people and products together. Unknowingly to him, Apodaca has started something. His video now serves as the base for Tik Tok’s ad campaigns, where he is joined by fellow Tik-Tokers and Mick Fleetwood himself in ads promoting creativity and personality . This can only be the beginning of a new era of user-generated content – one in which brands must surrender some sort of control to those they sell to.
The days are shorter, there’s a chill in the air, and holiday lights are dotting the night sky. Normally this season is a time to reflect on what we’ve accomplished this year, the good times we’ve had and the memories we’ve made. But this year is different. I can almost hear the record scratch as we turn the corner into 2021. So instead of reflecting on the year (see ya, 2020!), let’s leap into 2021 ready to take on new customers and refine our digital marketing strategy. Consumer habits have permanently changed as the result of the pandemic. Here are three things to prepare for as we look ahead to the coming year: Know your target customer. Their online behaviors have shifted this year. Make sure your website is relevant and meeting their evolving mobile commerce needs. According to U.S. census data, e-commerce sales increased 37% in Q3 of this year over the same period in 2019. In 2021, 54% of all retail e-commerce transactions are projected to occur on a mobile device. Is your website up to the task? Make sure your mobile shopping experience is fast, secure and includes large, easy-to-click links, product information and reviews. Increase engagement with your customer. It is exceedingly important to cultivate direct relationships with your customers, especially as the death of the cookie nears. Connect with them more personally through email and social. These low-cost tools drive high customer engagement and brand loyalty. Email marketing has been around for decades but remains a strong medium today. In 2021, plan to produce more personalized, conversational email marketing that closely addresses your customers’ needs. And grow those email databases! Capitalize on promotions to cultivate email addresses and preferences from both loyal and prospective customers. On the social side, Instagram has recently enhanced their search capabilities and expanded Reels, making 2021 the year to expand your stock of short, conversational videos that can be used across marketing channels. Which brings us to our last key opportunity… Capitalize on the rapid growth of streaming video. People are spending more time at home in front of screens, and streaming video consumption will continue to grow in 2021. In a survey conducted by Verizon Media , 60% of advertisers that are currently spending on CTV plan on increasing their buys in the first half of 2021 , a strong indication that this medium is proving to be effective. Streaming media—live and recorded—offers advertisers the opportunity to connect authentically with potential customers at a moment when they are truly engaged with that device. In addition, advanced targeting capabilities create efficiencies for advertisers while improving relevancy for the consumer. Now is the perfect time to streamline your marketing efforts and drive new customers, and at Phase 3 Digital, we will help you cut through the minutiae and execute solutions that make sense for your business. Contact us for help as you look ahead and plan for the coming year. And helloooo, 2021! We’re so happy you’re here. And, boy, do we have a story to tell you.

Since many nonprofit event fund raisers have been forced to be postponed due to the COVID pandemic, fundraising has become more difficult. Most nonprofit organizations are now having to rely on their digital marketing strategies more than ever. Here are some digital strategies that could help revitalize your fundraising goals. 1.) Revisit Your Social Media Presence: Social Media is a great and efficient way to fundraise since many of your donors most likely engage heavily with social media content. Post regular updates of your organization to boost your brand and be sure to take advantage of the Donate button available to you on Facebook. Make a plan to post footage from speakers, photos and visuals that inspire. Remember, the most engaging type of Facebook posts are videos. Another way to engage your audience is by asking positive questions of what inspires them. You can virtually go live and share video of sponsors or speakers answering questions of what your cause means to them. Research individuals that might agree with your efforts and consider contacting them to see if they are willing to link a post to your organization. 2.) Engage Your Email Audience: Email marketing is an inexpensive way to attract potential donors and sponsors. Weekly newsletters will engage your audience regularly on donation opportunities available. Set up an automatic email for new subscribers that will educate them on your organizations’ cause and thank them for joining. Construct a similar automatic email system for new donors as well, thanking them and showing them how to share with others. 3.) Reevaluate Your Website: Inspire your audience and regain momentum with your mission statement front and center, giving critical information about your branding and how to participate. Engage your audience with updated news, educational content, and membership information. Make sure to have video on your website when possible. Video is personal and inspires emotions and empathy. While gathering raffle tickets, eating buffet meals and bidding on items during an in-person event is not what it used to be, revitalizing your marketing strategy might be the best way to pick up momentum on your organizational goals.